In our 2024 Patent Roundup Report, we analyzed the patents granted by the United States Patent and Trademark Office (USPTO) from October 1, 2023, to September 30, 2024 (FY 2024), along with key year-over-year (YoY) changes from FY 2023. The dataset focuses on utility patents, excluding design and plant patents.
The USPTO Patent Statistics for FY 2024 highlights significant developments across multiple industries, reflecting major investments in technological innovation.
Patents granted by the USPTO in FY 2024
During FY 2024, the USPTO issued a total of 326,921 patents, with contributions from sectors including semiconductors, artificial intelligence (AI), data management, cybersecurity, automotive, and healthcare. This figure represents an ongoing commitment to innovation and technology development across a wide range of industries.
Samsung and LG leading the 2024 U.S. patent landscape
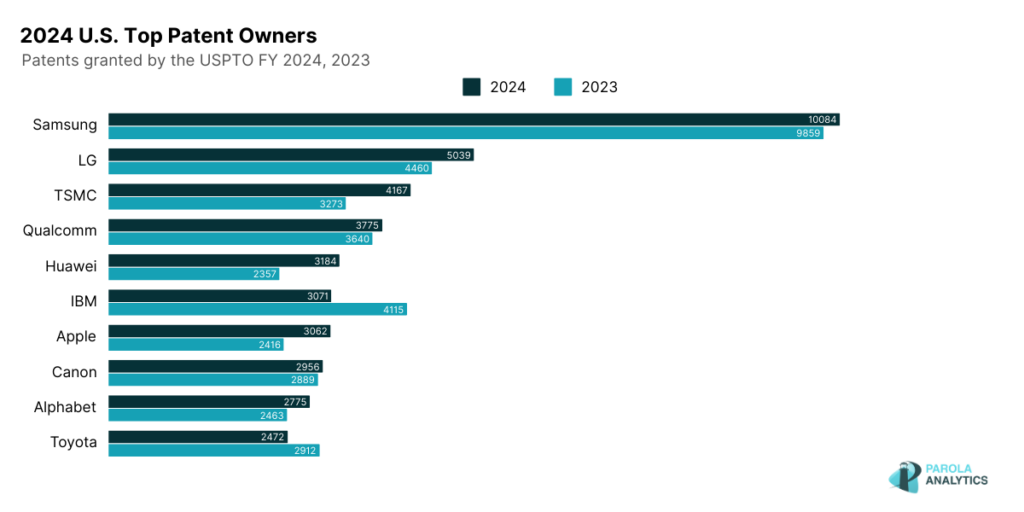
Samsung and its subsidiaries lead the U.S. patent landscape with 10,084 granted patents, more than doubling LG’s 5,039 patents, positioning both South Korean tech giants at the forefront of global patent filings.
Top Technological Areas: Semiconductors, AI, and cybersecurity
The top areas of technological innovation for FY 2024 patents reflect growing investments in semiconductors, AI, and cybersecurity. These fields are seeing substantial patent activity, reinforcing their importance in the evolving tech landscape.
Boost in user interfaces and semiconductor manufacturing
The most common CPC in FY 2024 was G06F3 (user interfaces), with 19,452 issued patents, highlighting ongoing advancements in displays, touchscreens, and input technologies. H01L21 (semiconductor manufacturing) experienced the highest year-over-year growth, increasing by 10.42%, driven by innovations in lithography and doping processes crucial for next-gen processors and AI chips.
Semiconductor innovation driving future AI market growth
Patents in semiconductor manufacturing and devices, including H01L21 and H01L27 (semiconductor devices), continue to grow in significance. These innovations are expected to play a key role in the projected market expansion for processors and AI chips, with compound annual growth rates (CAGR) of 9.6% and 20.4%, respectively, from 2024 to 2029.
In our 2024 U.S. Patent Roundup Report, we also feature the 2024 Top 100 Patent Filers at the USPTO, and a deep-dive on the patenting activity of top innovators such as Samsung, Alphabet, Bank of America, NVIDIA, and Johnson & Johnson.
Download the 2024 U.S. Patent Roundup Report.
2024 Top 100 Patent Assignees (USPTO)
| RANK | ASSIGNEE | FY 2024 | FY 2023 | YoY |
|---|---|---|---|---|
| 1 | SAMSUNG | 10,084 | 9,859 | 2.28% |
| 2 | LG | 5,039 | 4,460 | 12.98% |
| 3 | TAIWAN SEMICONDUCTOR MANUFACTURING (TSMC) | 4,167 | 3,273 | 27.31% |
| 4 | QUALCOMM | 3,775 | 3,640 | 3.71% |
| 5 | HUAWEI | 3,184 | 2,357 | 35.09% |
| 6 | IBM | 3,071 | 4,115 | -25.37% |
| 7 | APPLE | 3,062 | 2,416 | 26.74% |
| 8 | CANON | 2,956 | 2,889 | 2.32% |
| 9 | ALPHABET | 2,775 | 2,463 | 12.67% |
| 10 | TOYOTA | 2,472 | 2,912 | -15.11% |
| 11 | SONY | 2,315 | 2,181 | 6.14% |
| 12 | MICRON TECHNOLOGY | 2,172 | 2,230 | -2.60% |
| 13 | INTEL | 2,048 | 2,358 | -13.15% |
| 14 | BOE TECHNOLOGY | 1,985 | 1,803 | 10.09% |
| 15 | HYUNDAI | 1,947 | 2,048 | -4.93% |
| 16 | MICROSOFT | 1,883 | 1,870 | 0.70% |
| 17 | RTX | 1,864 | 2,098 | -11.15% |
| 18 | DELL | 1,854 | 2,010 | -7.76% |
| 19 | AMAZON | 1,823 | 1,817 | 0.33% |
| 20 | MITSUBISHI | 1,788 | 1,511 | 18.33% |
| 21 | JOHNSON & JOHNSON | 1,666 | 1,408 | 18.32% |
| 22 | PANASONIC | 1,662 | 1,365 | 21.76% |
| 23 | ERICSSON | 1,494 | 1,149 | 30.03% |
| 24 | HITACHI | 1,283 | 1,142 | 12.35% |
| 25 | SIEMENS | 1,274 | 1,223 | 4.17% |
| 26 | NIPPON TELEGRAPH & TELEPHONE | 1,271 | 742 | 71.29% |
| 27 | MEDTRONIC | 1,270 | 1,387 | -8.44% |
| 28 | CISCO | 1,255 | 1,289 | -2.64% |
| 29 | FUJIFILM | 1,239 | 1,245 | -0.48% |
| 30 | SK GROUP | 1,236 | 1,242 | -0.48% |
| 31 | SUMITOMO | 1,195 | 1,042 | 14.68% |
| 32 | CAPITAL ONE | 1,161 | 912 | 27.30% |
| 33 | FORD | 1,156 | 1,388 | -16.71% |
| 34 | TOSHIBA | 1,127 | 1,326 | -15.01% |
| 35 | SAUDI ARABIAN OIL | 1,124 | 1,090 | 3.12% |
| 36 | NEC | 1,113 | 886 | 25.62% |
| 37 | HEWLETT PACKARD | 1,089 | 1,278 | -14.79% |
| 38 | HONDA | 1,075 | 1,204 | -10.71% |
| 39 | SEIKO EPSON | 1,048 | 1,204 | -12.96% |
| 40 | ROBERT BOSCH | 1,038 | 1,050 | -1.14% |
| 41 | TENCENT | 1,035 | 658 | 57.29% |
| 42 | MURATA MANUFACTURING | 1,021 | 813 | 25.58% |
| 43 | GENERAL MOTORS | 1,017 | 904 | 12.50% |
| 44 | TEXAS INSTRUMENTS | 984 | 946 | 4.02% |
| 45 | APPLIED MATERIALS | 963 | 923 | 4.33% |
| 46 | FURUKAWA GROUP | 961 | 1,363 | -29.49% |
| 47 | CHINA STAR OPTOELECTRONICS | 945 | 465 | 103.23% |
| 48 | GENERAL ELECTRIC | 900 | 944 | -4.66% |
| 49 | HONEYWELL | 871 | 881 | -1.14% |
| 50 | NOKIA | 868 | 680 | 27.65% |
For the full US Top 100 Patent Assignees List, download our 2024 U.S. Patent Roundup Report.


